
The user calls complaining that a recurrent report, which usually completes in 15-20 minutes, is running for a few hours now. You request some more information from the user about the report and its database session, and start troubleshooting:
- Servers are healthy, no hardware failures.
- Server loads are within acceptable thresholds.
- ASM performance numbers are acceptable.
- Database alert logs show no recent incidents.
- The plan for the query looks good, with all tables being accessed through indexes (no FTSs) and with low cost.
- AWR shows the plan for the query’s SQL_ID hasn’t changed in the last days.
- A handful of V$SESSION samples shows the query is progressing (no locks, no cluster events).
- A dozen calls to V$SESSION_WAIT_HISTORY shows a high amount of “db file sequential read” events, and this is confirmed by looking up the session history on Oracle Enterprise Manager:

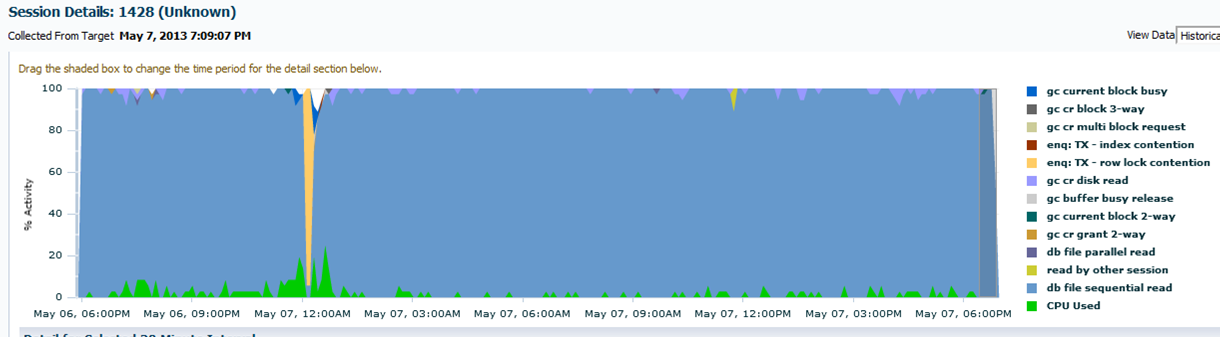
So, what’s the catch? Why is an indexed, low-cost plan doing a lot of sequential reads?
By taking samples of the P1 column in V$SESSION_WAIT_HISTORY (which for the “db file sequential read” event means the data file number) and querying V$DATAFILE, you get this result:
select name filenames from v$datafile
  where file# in (206,633,729,717,716,98,400,376,1191,752);
FILES
------------------------------------------------
+DATA/mydb/datafile/apps_undots7.1113.789102649
+DATA/mydb/datafile/apps_undots8.411.788871523
+DATA/mydb/datafile/apps_undots7.965.789059247
+DATA/mydb/datafile/apps_undots7.984.789064151
+DATA/mydb/datafile/apps_undots8.633.788938541
+DATA/mydb/datafile/apps_undots7.673.788950353
+DATA/mydb/datafile/apps_undots7.674.788950819
+DATA/mydb/datafile/apps_undots7.682.788953273
+DATA/mydb/datafile/apps_undots7.695.788956253
+DATA/mydb/datafile/apps_undots7.1407.789223379
Instead of index and table segments, the database is reading undo segments. Why is that?
When a data block is changed, Oracle stores the old values of the data on Undo segments. It happens this way so queries can retrieve a consistent image of the data as it was when the query (or its transaction) begun. This Oracle feature is called Multiversion Read Consistency and is detailed in the Database Concepts manual:
Whenever a user modifies data, Oracle Database creates undo entries, … Thus, multiple versions of the same data, all at different points in time, can exist in the database.
It happens that one of the tables read by this query gets frequent updates on a set of rows. As the query started, data got changed once, twice and eventually several times.
In this situation, the query’s server process has to fetch multiple undo blocks for each data block it wants, until it finds the version of the block consistent with the time it started, and this is a time and resource consuming operation.
The worst cases may even lead to the dreadful “ORA-01555: snapshot too old” issue.
The best solution for this situation is to have the report and the data changes run separately. As a workaround, killing the report and running it again will yield good results, unless the data changes again.
If you want to know more, deeper information on this subject (beyond Oracle’s own documentation) can be found on these two excellent blog posts:
- by Roger Schrag on “How Much Do Concurrent Updates Impact Query Performance in Oracle?“
- by Craig Shallahamer on the “Impact of Consistent Reads“
Feel free to leave a comment if you’d like to ask anything about this topic.

Hey Valter. Nice Article! But I have a question. How did you get that file numbers? I mean, how did you find the samples of the P1 column in V$SESSION_WAIT_HISTORY? Any specific query you could share?
Hi Vantuir, thanks! You may use this query to get the file numbers:
select p1

  from gv$session_wait_history

 where inst_id = &theinstance and sid = &thesid

   and event = 'db file sequential read';
You can run this query a dozen times, one or two seconds apart, then use the most frequently appearing file numbers in the other query (inside the post) to get the file names.
Best regards!